Table of Contents
- On which stage we perceive differently when we classified faces?
- Clarifying the Term 'Race' in My Research
- How I tried to answer this question?
- The Tools: Which Electrodes Did I Use?
- What I Found: The Key Takeaways
- Softwares and Tools I Used
- Paper Link
On which stage we perceive differently when we classified faces?
When I started reading about face perception, I found many studies. Most of these studies say that people see faces from their own race or species differently than others. But none of these studies answered my main question: At what point do we actually start to see these faces differently?
When does this happen? Right when the light hits our retinas? Or maybe a bit later, when the signals reach the occipital lobe at the back of our brains? Or is it even later, when our brain's "face recognition software" kicks in?
Clarifying the Term 'Race' in My Research
In my thesis, I use the term "Race".
I want to make it clear that I don't see "race" as a biological concept, and I'm not approaching this from a "racial" perspective. Instead, I borrowed the term from scientific studies that discuss the "other-race effect in face perception."
In simpler words, when I say "Race" in my research, I'm talking about faces that you don't usually see in your day-to-day life. For example, in my experiments conducted in Antalya, I used "Asian" faces as the "other" category. Why? Because there aren't many Asian people in Antalya, so these faces would be less "familiar" to the participants.
How I tried to answer this question?
In the world of vision science, the visual hierarchy theory is a cornerstone. It tells us that there are three main stages when our brain classifies what we see:
- Superordinate Level: Is it alive or not?
- Basic Level: What kind of thing is it? (e.g., a dog)
- Subordinate Level: What specific type is it? (e.g., a pitbull)
Interestingly, research has shown that our brain can spot an animal in just 120 milliseconds but takes a bit longer to figure out it's a dog. This quick initial categorization happens at the Basic Level, which aligns perfectly with the focus of my experiments.
So, if you see a pitbull, your brain first decides it's a living thing, then identifies it as a dog, and finally as a pitbull. Given this, I chose to zoom in on the "Basic Level" for my experiments. Participants were asked a simple question: "If you see a face, click on X; if you don't see a face, click on Y."
You might be wondering, "Why did I choose to focus on the 'Basic Level' and not go deeper into the 'Subordinate Level'?" The answer lies in my interest in low-level visual properties. By keeping the research at the Basic Level, I could delve into the nitty-gritty of early visual processing without getting entangled in the complexities that come with higher-level categorizations like gender or specific facial features.
Moreover, a glance at the current ERP-face literature reveals that many studies are already exploring questions like "What gender is this face?" or "Is this face familiar?", even some attentional oddbal tasks... These questions often require processing at the Subordinate Level, which involves more complex and high-level facial features. My aim was to strip away these complexities and get down to the basics—literally. This approach allowed me to isolate and study the fundamental visual cues that our brains use for face perception, making the research as low-level as possible.
But thats not enough...
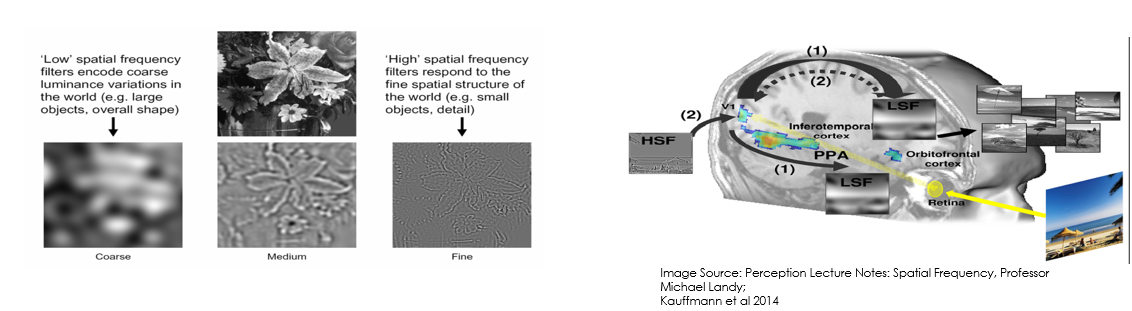
This could be answer my question partly but I wanted to know more. So I decided to use "Spatial Frequency", more precisely "Coarse-to-Fine" theory in human vision. According to this theory, when we see an object in the world, we first perceive it's coarse features (low spatial frequency) and then fine features (high spatial frequency) so in the brain a fast-forward mechanism works like this: coarse features -> fine features -> classification.
See bellow image for more details:
 |
|---|
| How brain process a visual object |
So what I did?
Armed with Python code and some nifty image processing techniques like Fourier Transform, RMSE, and luminance normalization, I set out to explore Spatial Frequencies (SFs). I designed my experiment using E-Prime software. A big shoutout to my awesome colleagues Nurullah, Furkan, and Semih for their invaluable help! Together, we conducted the experiment in our lab and managed to gather data from 30 participants using EEG, all within two weeks.
What I analyzed?
I dived deep into the Event-Related Potentials (ERPs) for each participant. Specifically, I looked at:
- P100: Important for early visual processing
- N170: Crucial for face perception
- N250: Relevant for recognizing familiar faces
The Tools: Which Electrodes Did I Use?
For the EEG recordings, I used a variety of electrodes but focused my reporting on those placed on the occipital lobe, which is the brain's visual processing center. The electrodes I reported are:
- O1 and O2: Standard occipital electrodes
- PO3 and PO4: Parieto-occipital electrodes
- PO7 and PO8: Additional parieto-occipital electrodes
What I Found: The Key Takeaways
I discovered quite a bit through my research, but I've focused on reporting the most crucial findings.
No Other-Race Effect in Early Stages: While I did find some significant results in the N250 ERP (especially in the PO electrodes), there were no significant differences in the P100 and N170 ERPs between Asian and Caucasian faces. This suggests that, at least in the early stages of visual processing, we don't perceive faces of different races differently.
Species Differences in Higher Frequencies: Interestingly, faces of other species didn't differ from human faces in the low spatial frequency domain. However, we do perceive them differently in the high spatial frequency (HSF) or broadband, especially in the P100 ERP. This difference becomes even more distinct in the N170 and N250 ERPs.
My thesis is still under review, but I've conducted many detailed analyses and learned a lot. You can find the published version of my thesis here.
Note: Due to the length of the paper, I didn't include the N250 results in the pre-print version. Rest assured, they are thoroughly reported in my full thesis.
Softwares and Tools I Used
Open-Source Contributions
I love open-source and have contributed some tools that I wrote myself:
EasyLab: I created a Python GUI as a gift to my lab! It's perfect for resizing images, renaming them with a prefix for easy reading in E-Prime 3.0, and even processing Spatial Frequencies using Fourier and Butterworth filters.
Scramblery: This tool is for scrambling images. I used scrambled images as a control condition in my research. It's open-source, and there's even a cool JavaScript version that runs online!
Try it out here: Demo
- butter2d: Rust implementation for Butterworth filter.
Proprietary Software
BrainVision: I used this for my EEG recordings and initial data filtering. Unfortunately, it's not open-source.
E-Prime 3.0: I used this for my experiment design. It's buggy and makes you want to pull your hair out, but it's the best option out there for designing experiments. It's also not open-source. Made me think about creating an open-source alternative in the future using Rust while I was using it. Maybe one day!
Data Analysis
- R: After collecting the data, I did all my analyses using R. You can check out my workflow in this gist file.
The Fuel: Coffee, Music and Friends
- Coffee: Consumed in large quantities. I wasn't picky about the brand.
- Music: Candlemass kept me company during those long hours of research. I dig into the doom.
- Friends: I couln't have done it without my friends. They were both my emotional and technical support. Thank you Nurullah, Furkan and Semih! I'm forever grateful for your help. <3 Friendship in the lab is the best thing ever. I'm so lucky to have you guys!
Paper Link
You can read the more boring parts on here
Cite:
Altun, E. (2023, January 01). My thesis in TLDR. Retrieved from https://altunenes.github.io/posts/thesis/